CoVid-19 Data Analysis
Menu to Investigations
Cases Over Time
Case Rate Density
Recovery Rate
Table of Cases (US)
Case Density of CoVid-19
Maps and Graphs of CoVid-19 Around the World
Tableau worksheet for CoVid-19
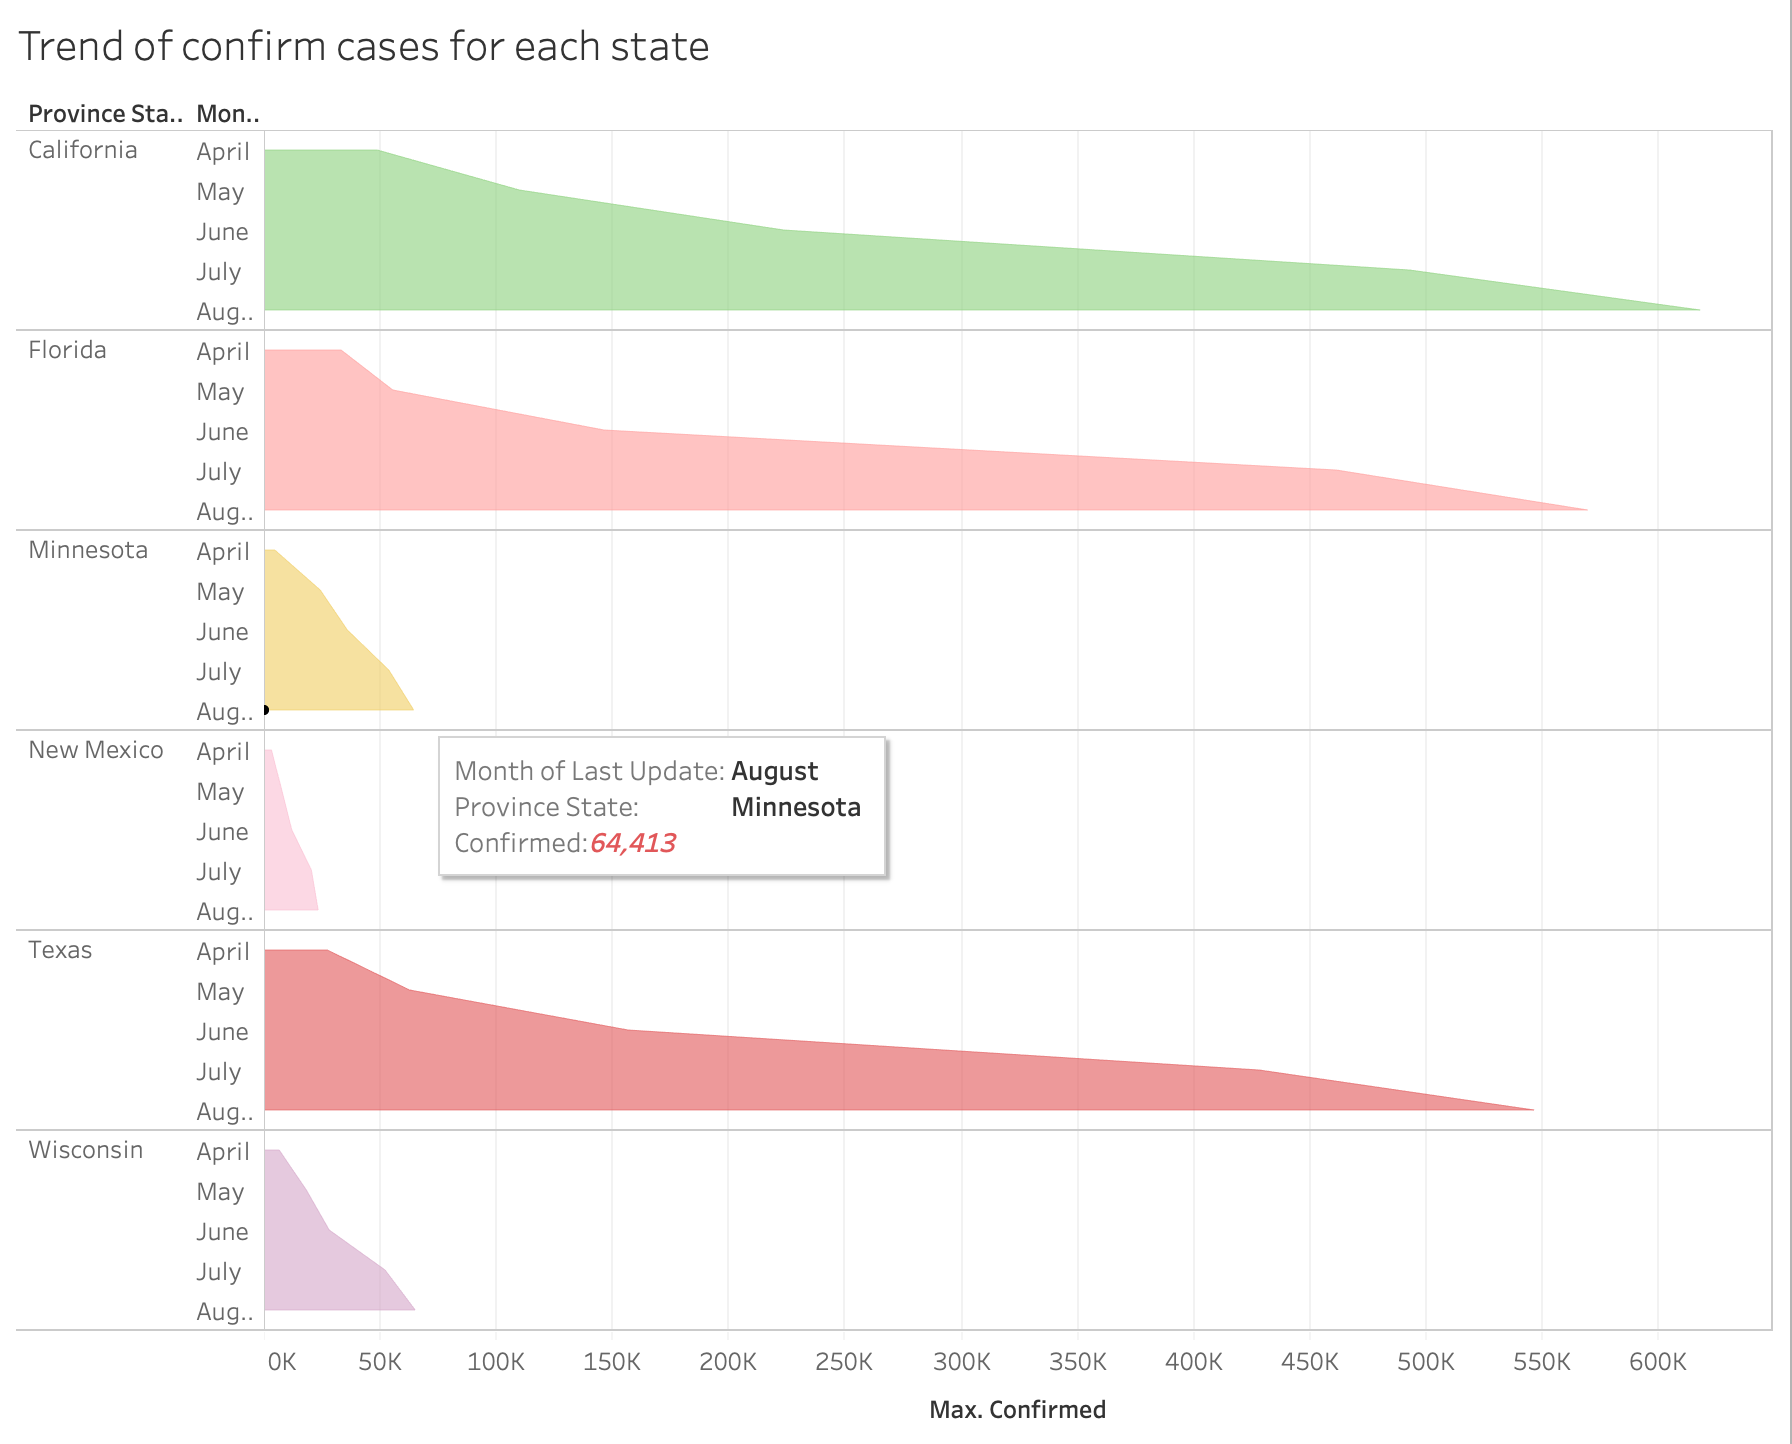
CoVid-19 cases distribution in the US until August 13, 2020
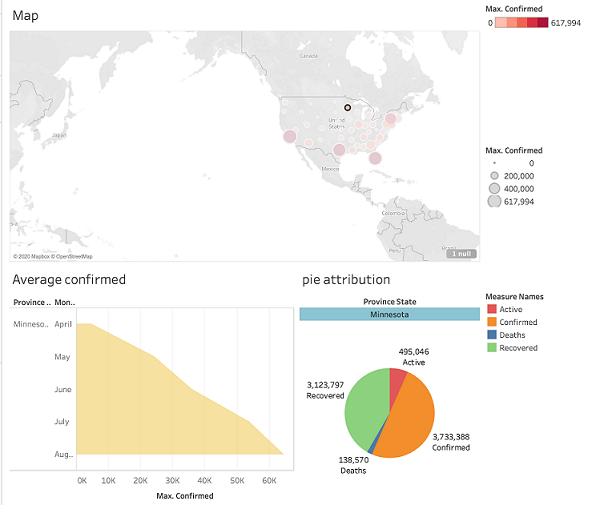
General information for the state pined in the map (interactive graph)
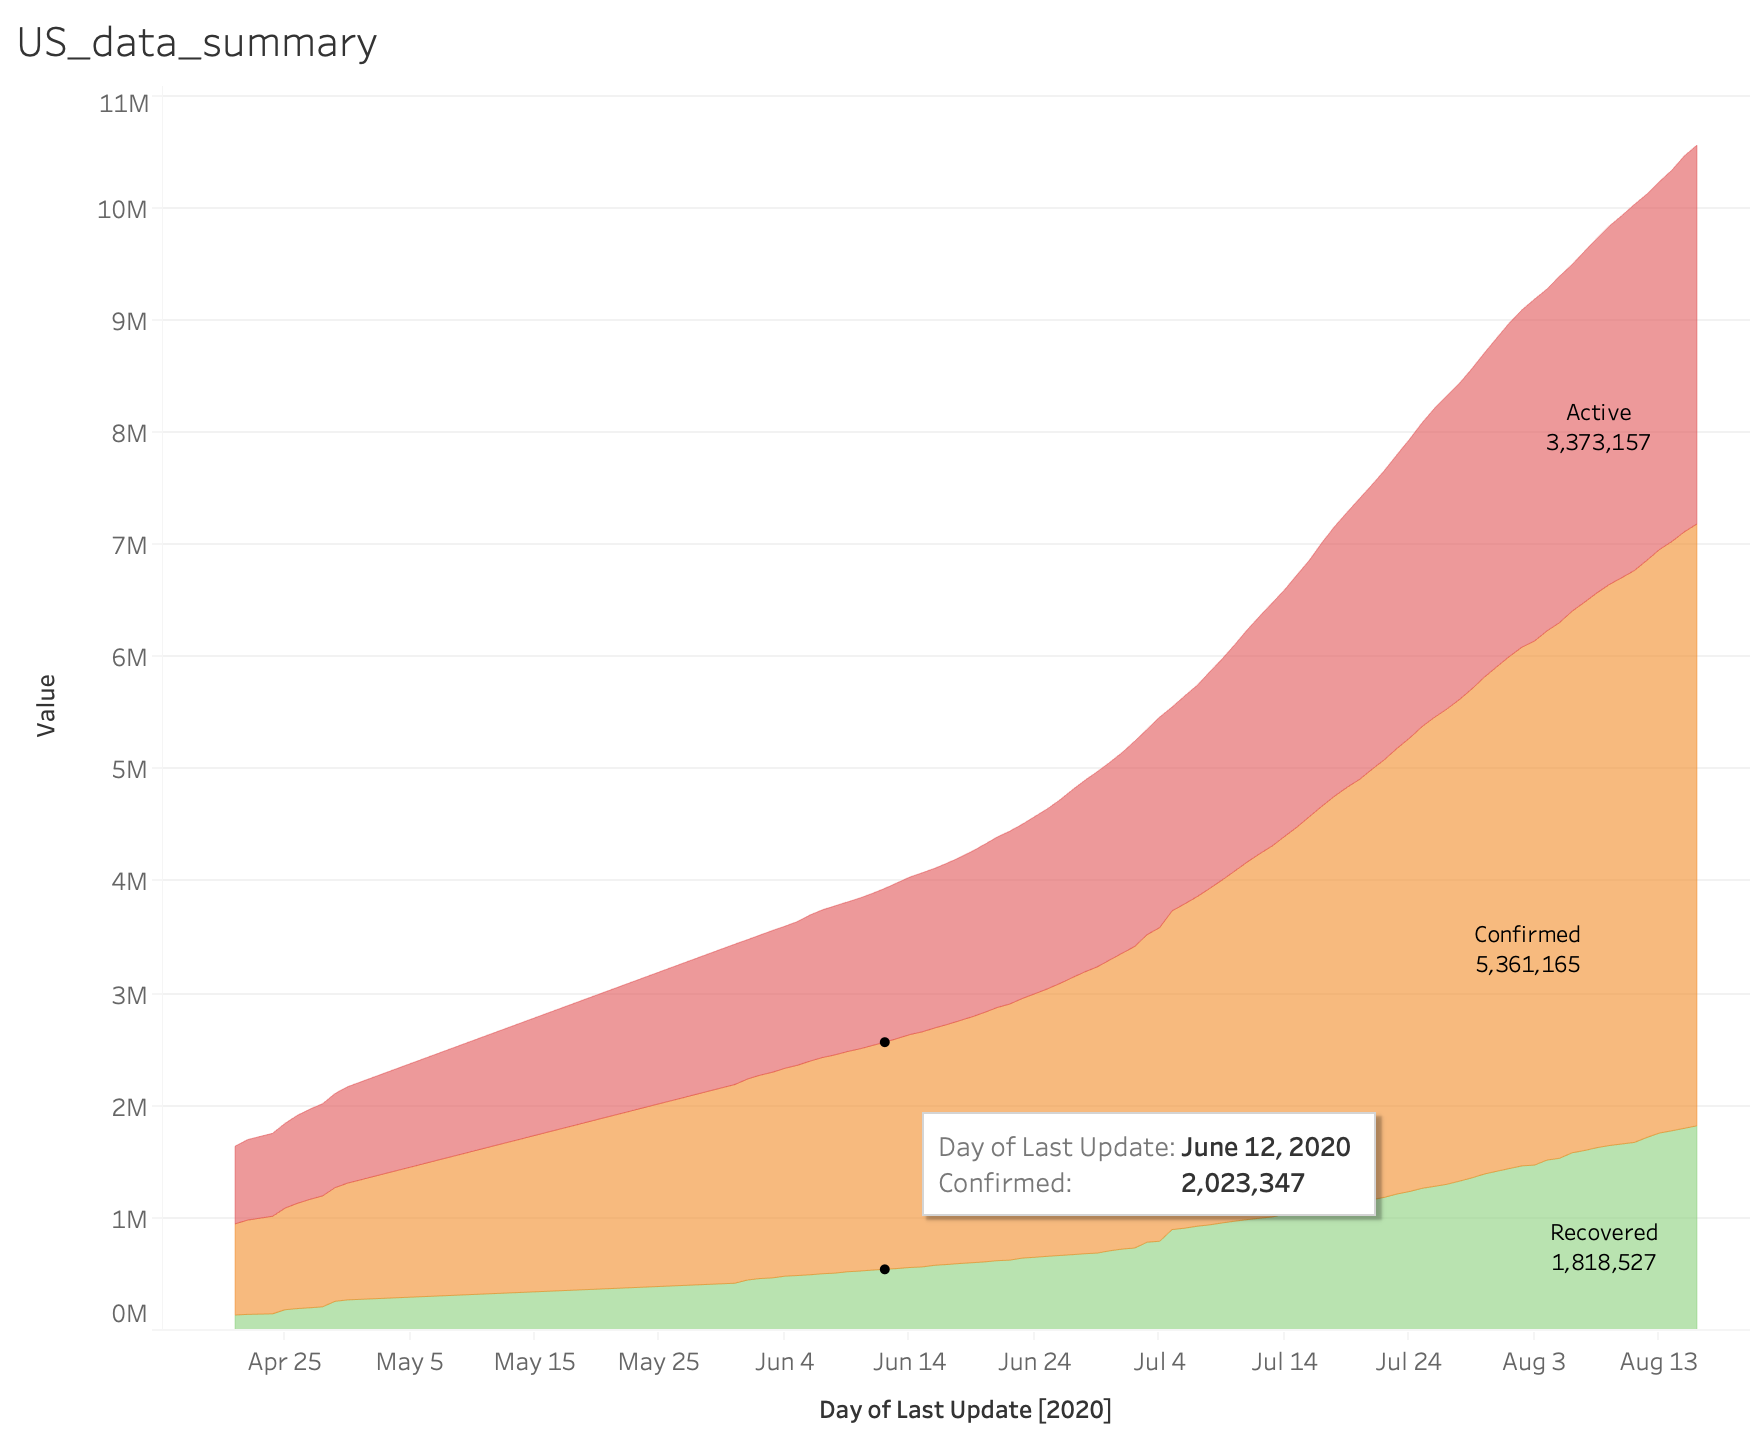
Overall information for the US
With more confirmed cases in the state, the marker gets darker and bigger
Select states you are interested in and get the comparison of their
External Links
We used Tableau to develop the above images and graphs. Follow the link here to see the public data:
Tableau Dashboard
a J. C. Leibfried product